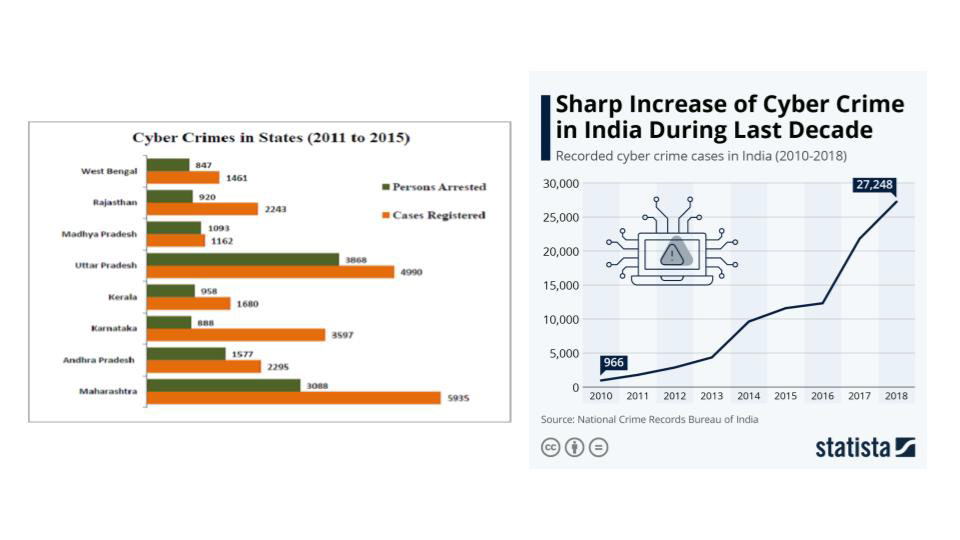
Cyber Crime in States - Isotope Chart

With increasing mobile and internet penetration in the country, cyber crimes have also increased proportionately. Between 2011 and 2015, more than 32000 cyber crimes were reported across the country.
The aim here was to show the rising rate of cyber crime during the said period and show a comparison between states of Karnataka and Maharashtra in India.
Analyzing the Data
Ideally, pictograms should covey an effective comparison of data. The challenge was to highlight the issue of rising crime in states and communicate that visually in a way that is easy to read and comprehend as opposed to traditional line or bar graphs. The two states chosen for the isotope for comparison, show a comparative data of the number of cases registered and number of people arrested. Thus a visual representation of such a data can be effectively done using an isotope.
Mood board
A stranger in a hoodie and a person in a handcuff convey the idea of cyber crime and whether an arrest was made or not.

Isotope Chart
The colour palette chosen here, primarily consists of blue which is often related to the IT world. Sans serifs typeface was chosen to give a cleaner look. Vertical bar on the left gives a basic info on cyber crime and a guide to read the chart.

Resources
Content : www.factly.in
www.statistica.com
Mockup : www.freepik.com